

Why 20 Kg Is Never Really 20 Kg
A Practical Guide To Center Of Gravity Offset, Payload Curves, And Why Two Robots Rated For The Same Payload Can Behave Very Differently
Product & Technology
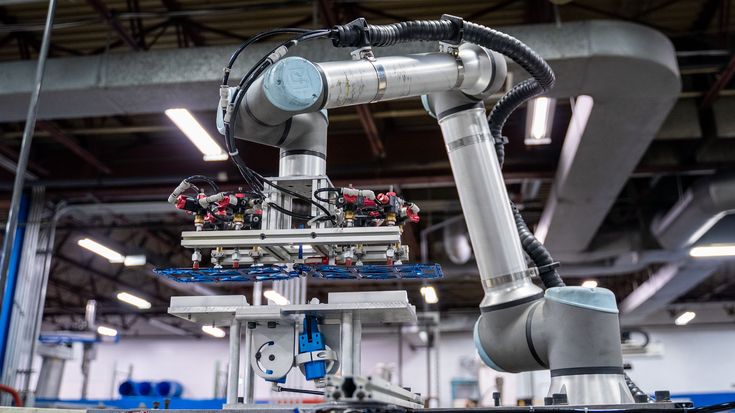
Every cobot spec sheet leads with a single number such as 20 or 30 kg. It is the first thing a customer sees, the first thing they compare, and the first thing that gets written into an RFQ.
It is often treated as the most important consideration in an application, yet just as often buyers misunderstand what this number actually means
Rated Payload Describes The Flange, Not The Application
A robot's payload capacity is limited by joint torque, and torque is force multiplied by distance. The further the combined center of gravity sits from the tool flange, the more torque the wrist joints must produce to hold and move the same mass.
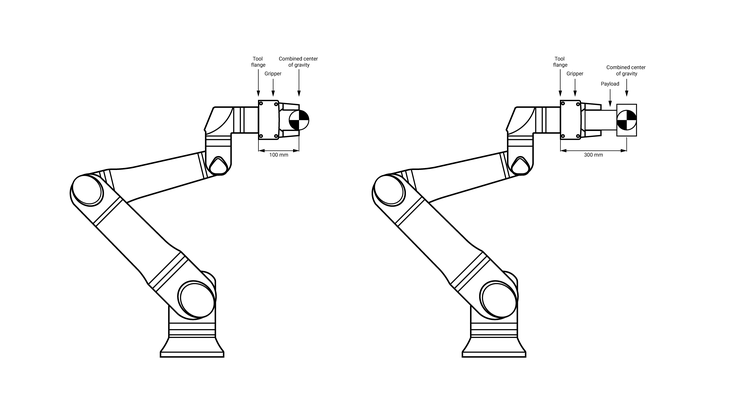
On a specification sheet, it is assumed that the load sits near the center of the flange. In practice this is often not the case. A gripper, a tool changer, a sensor bracket, and the part itself move the mass outward, often by 200 to 300 mm.
This is why manufacturers publish a center of gravity payload diagram showing how rated capacity falls as center of gravity offset grows. That curve, not the number on the front page of the sheet, is what governs the application.
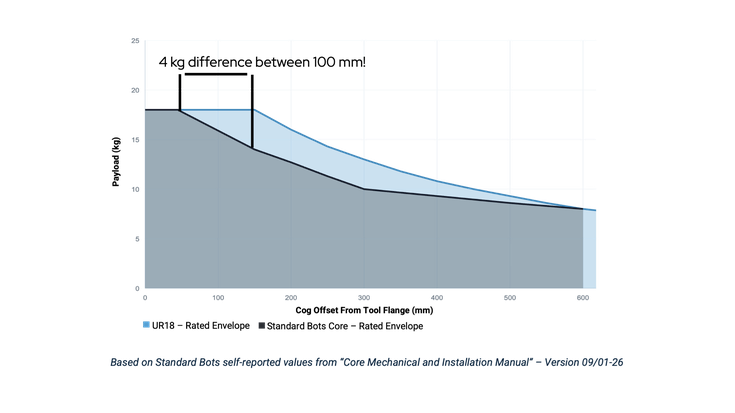
Every robot’s curve is different. Some robots can support a large offset reaching 150 mm while others start to see declines at only 50 mm. In general, the narrower the window the fewer applications the robot can support, and the more likely it is to cause problems, with an engineer left to explain why it is not hitting its numbers.
A Sizing Error Rarely Announces Itself
Staying within this window is often difficult, because there is rarely an obvious error when you get it wrong. And these mistakes can be expensive.
There is no fault code that says the application was sized wrong. Instead, there is increased wear, protective stops that are difficult to reproduce on demand, speeds dialed back to make the motion stable, and a cycle time that settles ten or fifteen percent above the expected performance — enough to erode the payback calculation but not enough to point to a single cause.
Because the symptoms are diffuse, they usually get attributed to something else. The program is blamed, then the gripper, then the part presentation. Meanwhile the joints are working harder than the sizing assumed, on every cycle, so they wear faster and need servicing sooner than planned.
Three Things To Read On A Payload Curve
Where The Curve Is Flat.
Every curve holds full rated payload for some distance before dropping off, and that distance varies far more between suppliers than the headline number does. As seen above, both arms in the chart are rated at 18 kg. One holds that figure to 150 mm while the other declines at around 50 mm. By the time we reach 150mm offset one robot is capable of the full 18kg payload while the other is limited to only 14kg and this is despite identical ratings in the spec sheet. That’s a significant difference in usable capacity at an offset most applications work at.
Where The Curve Declines
After this plateau, the slope decides how much offset is left for other critical components like tooling, sensors, cameras etc. A curve that drops hard through the 200 to 400 mm band punishes exactly the additions teams make most often. Grippers, the weight of the payload being picked up, sensors, cameras, and more all extend this number further.
What Conditions Attach To The Curve
Depending on the supplier, the payload figure on the spec sheet itself may also assume reduced speed or limited acceleration. Other times it may require a specific wrist orientation, a specific mounting position, or a robot that is not running continuously. While none of these limitations are necessarily hidden, and most are found in the manual, they seldom enter the comparison.
The Engineering Behind the Curve
Producing these curves is hard work. Behind every one of them is the internal logic that governs how the arm moves, and that logic has to be calculated, tuned, and proven before anything can be published.
To promise a payload at a given offset, you have to be able to predict the behavior of several parts of the robot at once. That means knowing:
- Gravity torque in every joint configuration, not one representative pose
- Friction that changes with velocity, with load, and with joint temperature, so the torque lost to it is never a fixed figure.
- Heat, because the torque a joint delivers for a short period is not the torque it can deliver across an eight-hour shift
- Structural deflection under an offset load, which under acceleration is what makes an arm oscillate and forces its limits down
- Stopping distance, since a collaborative arm must come to rest within a bounded distance from any speed, at any offset
Combining them is harder still, because they interact. Deflection changes with load, friction changes with the heat that load generates, and stopping distance depends on both.
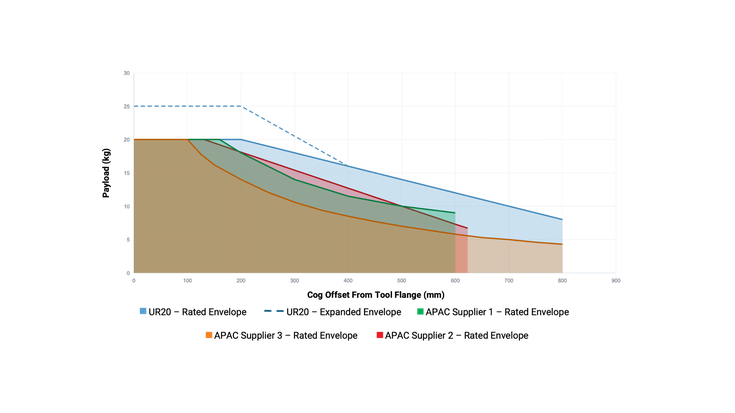
Each has to be modelled, and the curve is where all of those models meet. It is only as good as the weakest model feeding it. This is why it has taken decades of tuning, optimizing, and developing the algorithms that do exactly this. It is why two robots, built from comparable structures, can carry their rated payload to very different offsets.
Flying Too Close to the Curve
The one thing the headline number does not tell you may be the most consequential. A payload figure can be specified for the worst case, with the least favorable combination of poses, at full speed, in the most demanding orientation. Or it can be specified for the best case, with perfect wrist orientation, reduced acceleration, and limited duty cycles. Both approaches produce a curve, but the behavior changes drastically once the robot is deployed in a real application.
A worst-case figure is a floor. It shows how the arm will perform during the most demanding application. A best-case figure is a ceiling that the arm can only reach under ideal conditions, often not reflecting reality.
Universal Robots specifies to the worst case because our robots are production equipment, built for real deployments in industrial settings. A curve that only holds in ideal conditions has not removed risk. It has transferred it to the customer.
For a buyer, the practical consequence is that two spec sheets showing the same number can mean opposite things. One is what you can count on. The other is what you might achieve. Nothing on the front page distinguishes them, only the curve and the conditions printed beside it.
Headroom is what keeps those two from diverging. Understanding the arm precisely is not, in the end, about publishing a bigger number. It is about publishing one that holds.
Before you specify your next robot, check the manual for the CoG curve. Request it alongside the rated payload, and check the conditions printed beside it. Add up everything that will sit past the flange, including the payload, and work out where the combined center of gravity actually falls. Then confirm that the point sits inside the curve, with room for the tooling you will add later.

